Customer Behavior Analysis
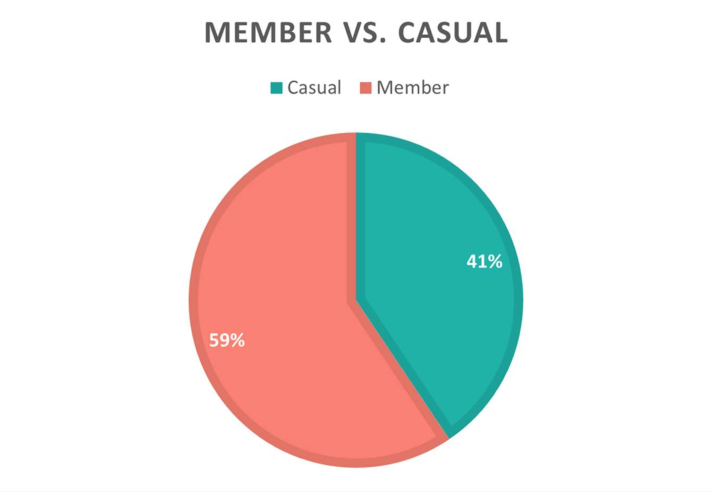
With a wapping 41% of its customer base being casual (meaning not a subscribed member), Cyclistic is set out to design a new marketing strategy that could turn its casual users into long-term subscribers. Before doing that though, it needs to understand its customer behavior.
Tools used:
● Excel for initial exploration
● Python for further analysis and visualization
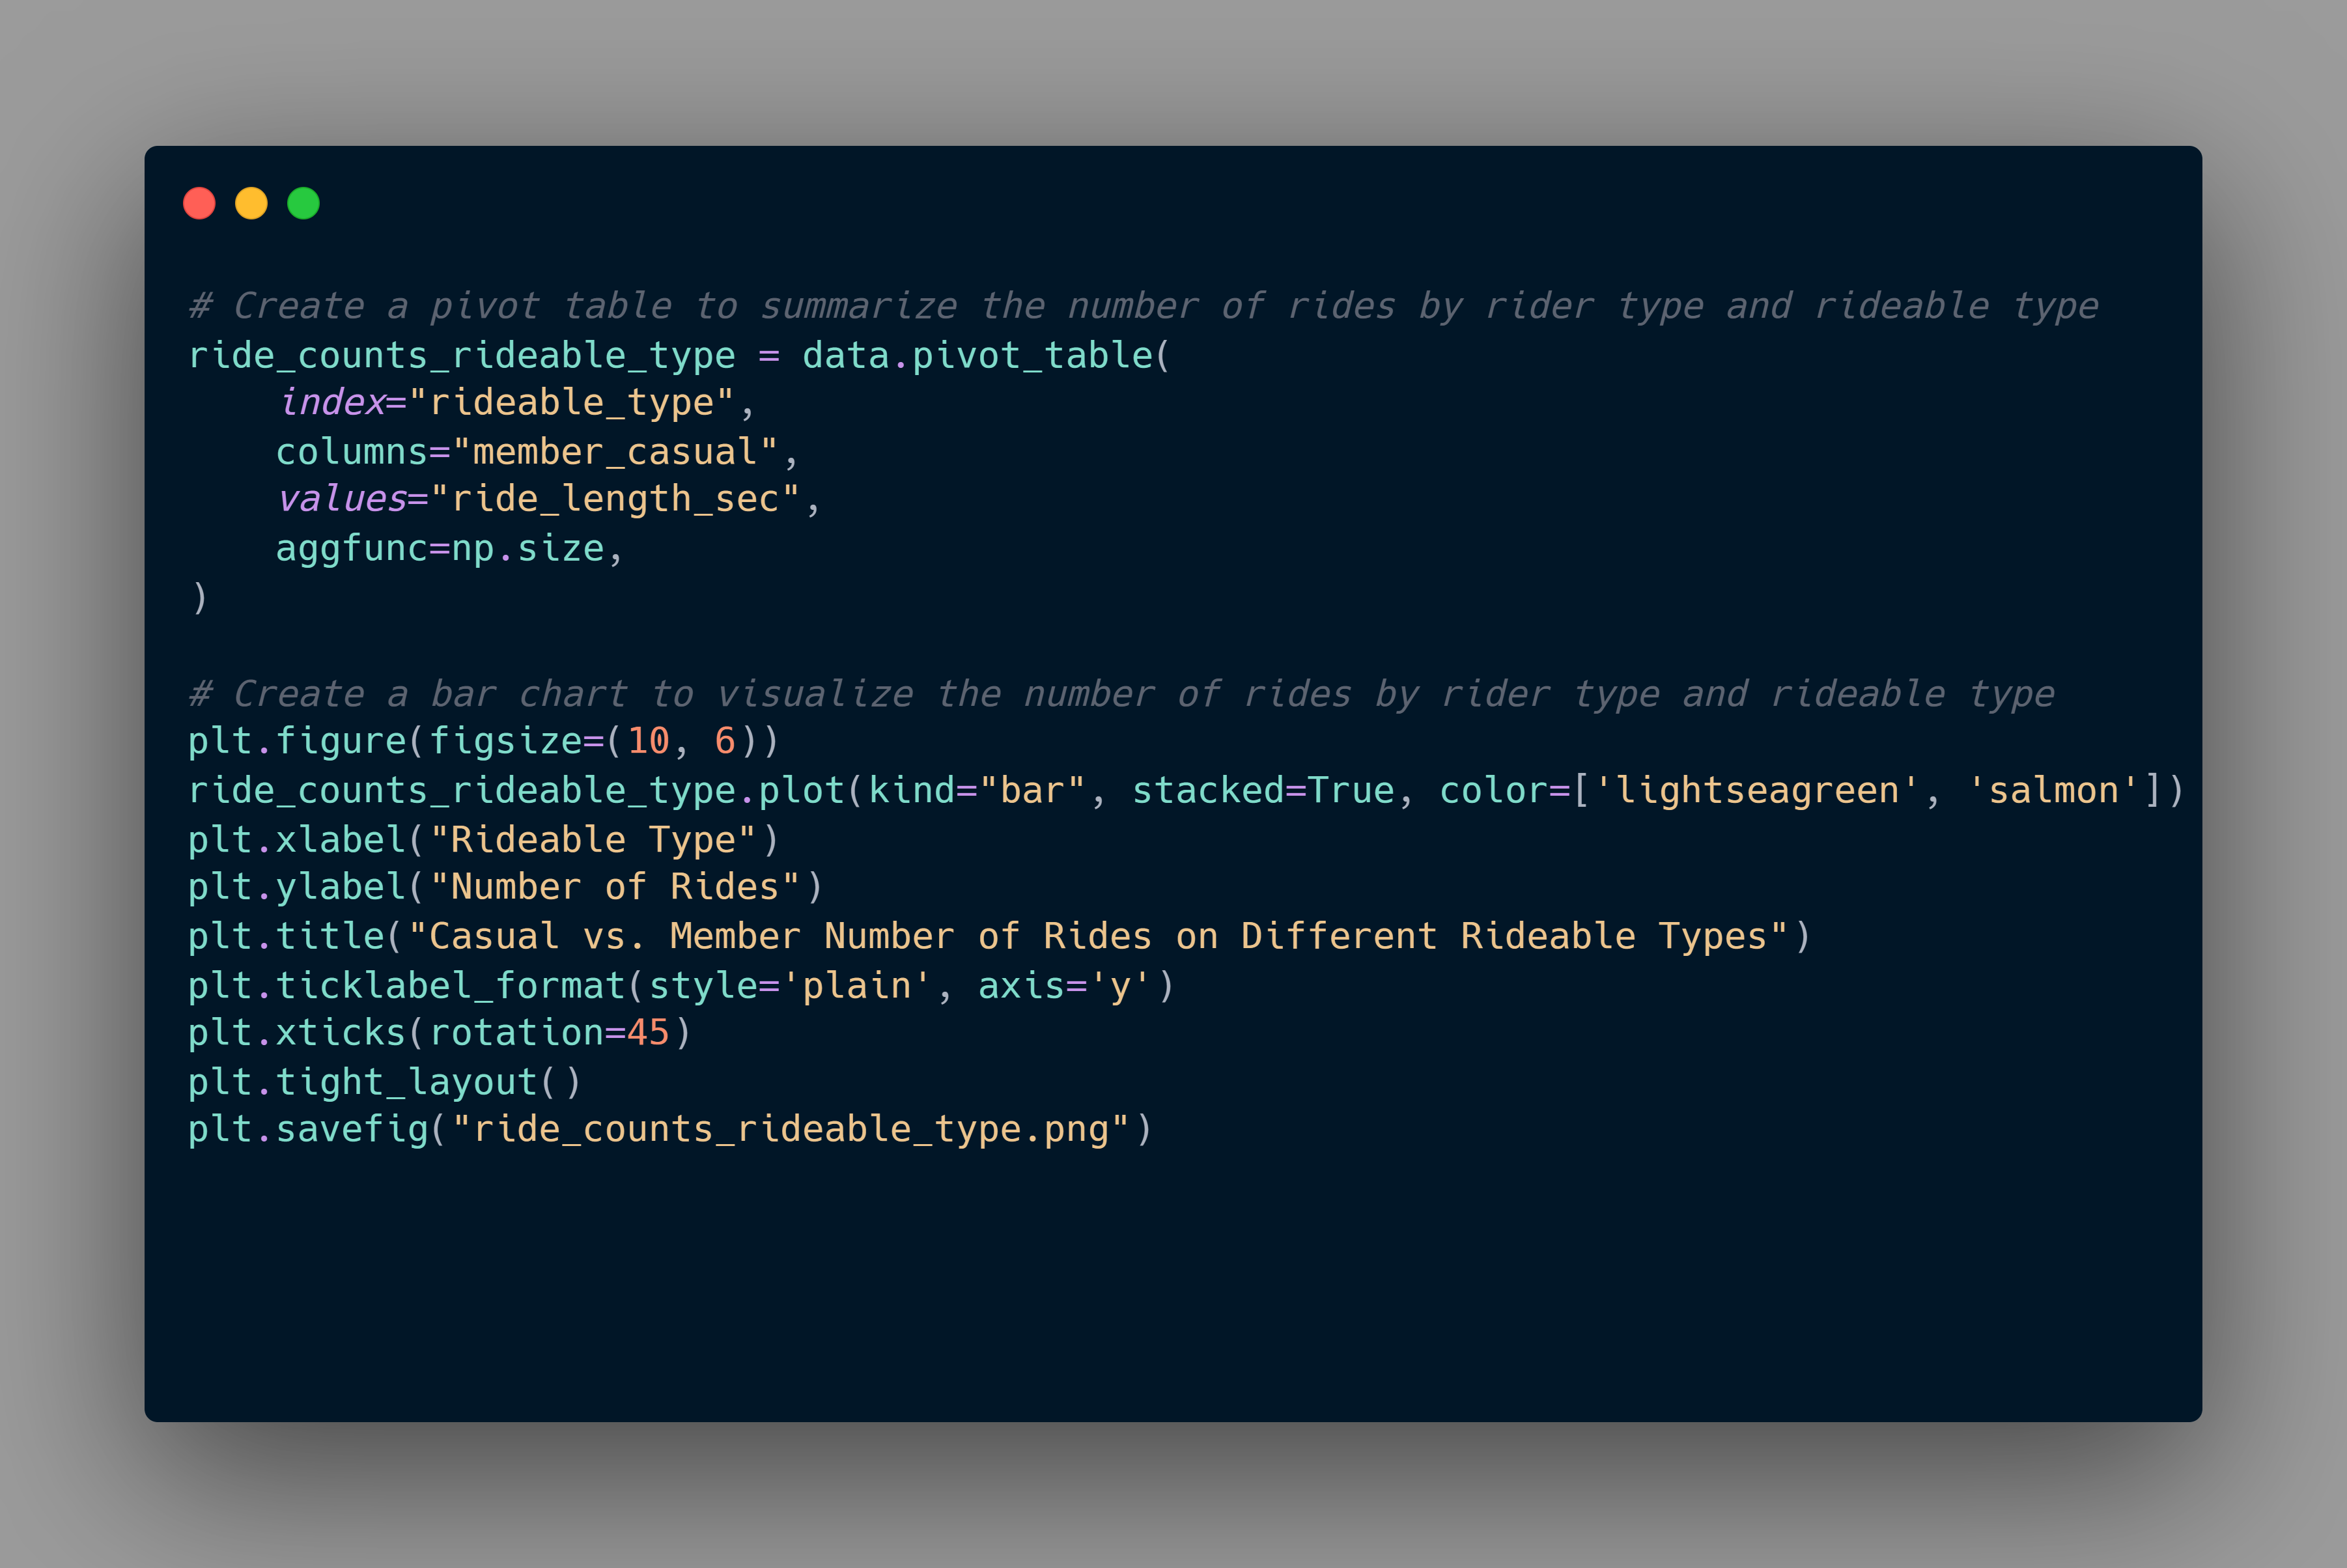
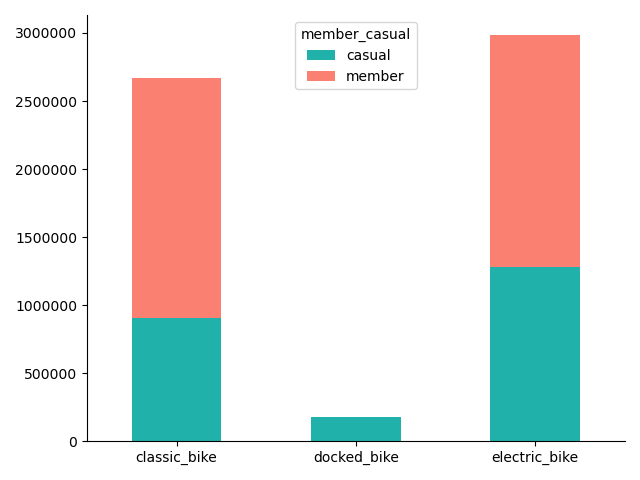
The above code generates the chart below. I have edited some of the features to make it visually appealing.
Key Findings
- Members dominate on the weekdays.
- Members dominate throughout the year, yet we have a surge of casual users in the months of June, July, and August.
- Strangely, the average trip duration throughout the weekday shows that casual members have the higher position. This suggests that casual members take longer trips.
Top 3 recommendations
1. To effectively engage with casual members, it's recommended to
schedule outreach efforts during the weekends, when they tend to be
most active.
2.
Providing a diverse range of docked bikes can entice users to explore
more areas, increasing their overall satisfaction with the service.
3.
Creating a summer marketing campaign can be a great way to attract
more casual users during the peak season, encouraging them to take
advantage of the service's benefits.
*If you want to explore this project in its entirety, check out its GitHub repository here